<?xml version="1.0" encoding="utf-8"?><feed xmlns="http://www.w3.org/2005/Atom" ><generator uri="https://jekyllrb.com/" version="3.10.0">Jekyll</generator><link href="https://ademgashi.com/feed.xml" rel="self" type="application/atom+xml" /><link href="https://ademgashi.com/" rel="alternate" type="text/html" /><updated>2026-07-10T12:25:54+00:00</updated><id>https://ademgashi.com/feed.xml</id><title type="html">Adem’s Homepage</title><subtitle>Adem&apos;s academic portfolio</subtitle><author><name>Adem Gashi</name><email>adem.gashi@unige.ch</email></author><entry><title type="html">The Hungry Brain: Why Thinking Is So Expensive, and What Happens When Food Runs Low</title><link href="https://ademgashi.com/posts/2026/07/the-hungry-brain/" rel="alternate" type="text/html" title="The Hungry Brain: Why Thinking Is So Expensive, and What Happens When Food Runs Low" /><published>2026-07-09T00:00:00+00:00</published><updated>2026-07-09T00:00:00+00:00</updated><id>https://ademgashi.com/posts/2026/07/the-hungry-brain</id><content type="html" xml:base="https://ademgashi.com/posts/2026/07/the-hungry-brain/"><![CDATA[<p>Your brain weighs about as much as a small melon, yet it eats like a teenager. Even when you are sitting still and thinking about nothing in particular, it burns through energy at a rate that no other organ of its size comes close to. This single fact, that the brain is metabolically expensive, turns out to be one of the most important constraints in all of neuroscience. It shapes how neurons are built, how they signal, how we learn, and, as recent work suggests, how the brain rations its own performance when food becomes scarce.</p>

<p>This post walks through four ideas. Why the brain is so costly to run. Where exactly that energy goes. What it costs to learn. And a question that has only recently been answered with real data. Is there a low power mode of the neocortex in times of food scarcity?</p>

<h1 id="information-processing-in-the-brain-is-metabolically-expensive">Information processing in the brain is metabolically expensive</h1>

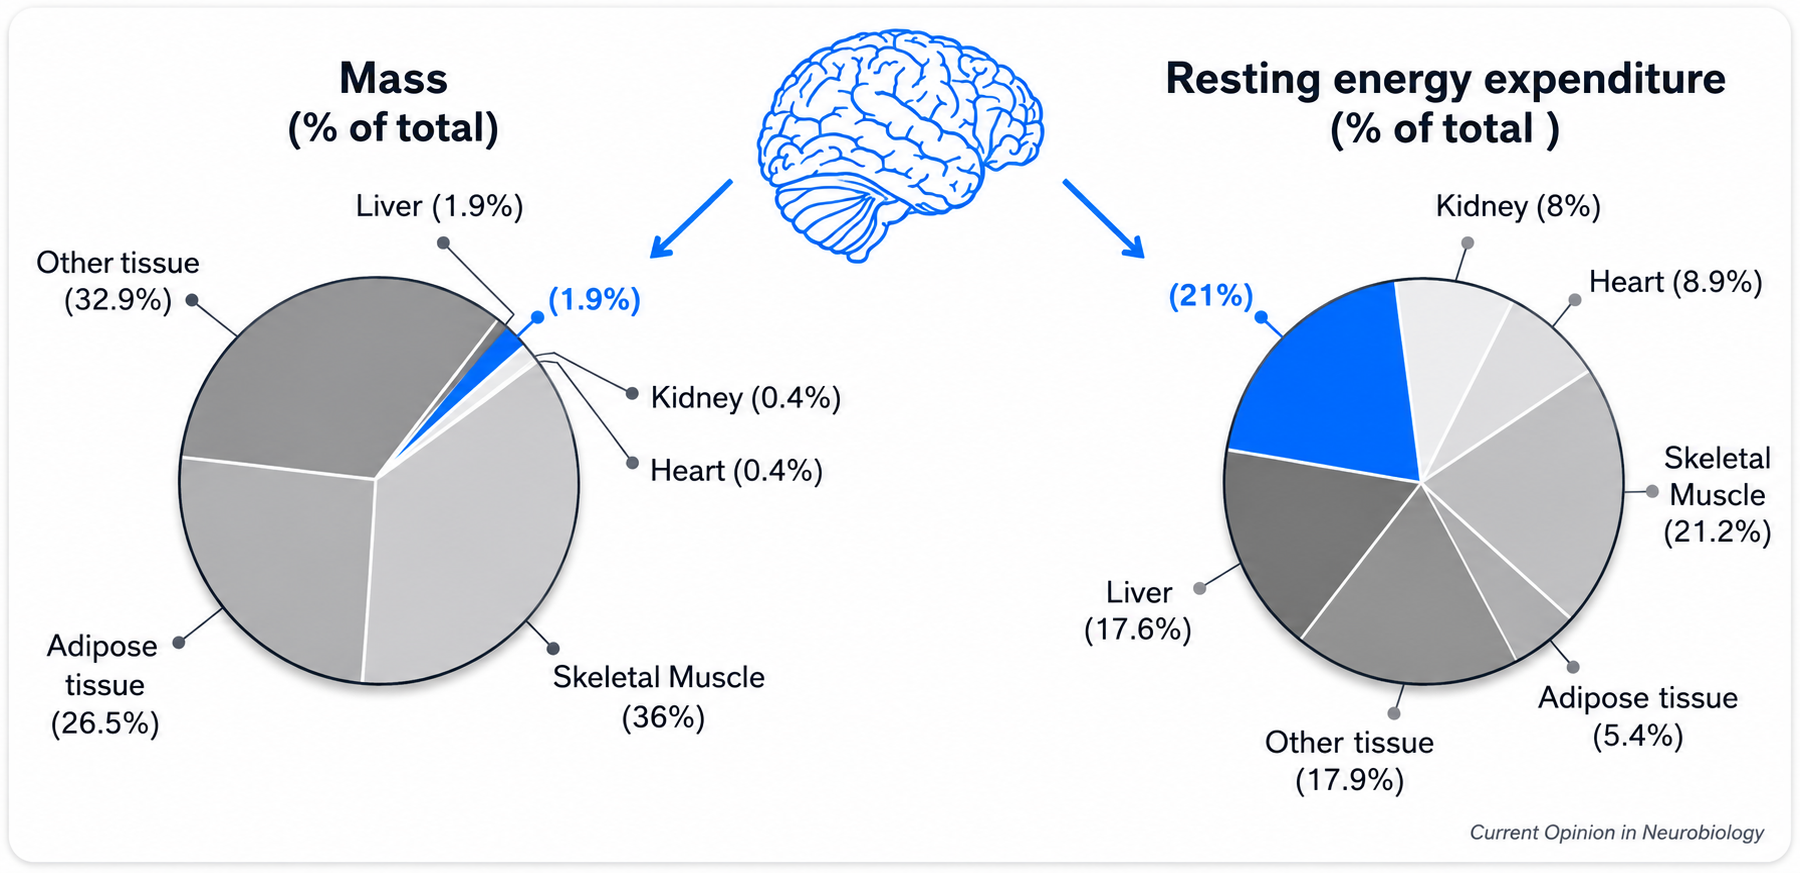
<p>Let us start with the headline number. The adult human brain accounts for only about 2 percent of body mass, yet it consumes roughly 20 percent of the body’s energy at rest (Herculano-Houzel, 2011). In everyday terms, that is somewhere around 500 kilocalories a day, a fifth to a quarter of everything you eat, all spent on an organ you could hold in two hands.</p>

<p>To appreciate how lopsided this is, it helps to compare the brain to other organs. By mass, the brain is a minor player. Skeletal muscle and fat dominate the body. But when you look at resting energy expenditure rather than mass, the picture flips dramatically. The brain jumps from contributing under 2 percent of body mass to consuming on the order of 20 percent of resting energy, which puts it in the same metabolic league as the liver, heart, and kidneys despite being far smaller (Padamsey and Rochefort, 2023). Gram for gram, neural tissue is one of the most energy hungry tissues your body maintains.</p>

<p><img src="/images/hungry_brain_1.png" alt="Pie charts comparing the brain's share of total body mass, about 2 percent, with its share of resting energy expenditure, about 21 percent" /></p>

<p><em><strong>Fig. 1.</strong> The brain is a minor player by mass but a major one by energy use. Adapted from Padamsey &amp; Rochefort (2023).</em></p>

<p>Why is the brain so costly? The short answer is that thinking is electrical work, and electrical work costs energy. Neurons constantly pump charged ions across their membranes to maintain the voltage differences they use to compute and communicate. Every signal a neuron sends, and every signal it receives, runs down those gradients, and the cell must then spend energy to pump them back up again. That energy comes in the form of a molecular fuel called ATP, short for adenosine triphosphate. The brain is, in effect, paying a continuous electricity bill just to stay ready to process information.</p>

<p>This is not a uniquely human extravagance. Across rodents and primates, the energy a brain uses scales in a remarkably orderly way with its number of neurons, so that each neuron costs roughly the same to run regardless of the size of the animal (Herculano-Houzel, 2011). The human brain is expensive not because our neurons are unusually greedy, but because we have so many of them. The bill is simply the sum of a vast number of small, fixed costs.</p>

<h1 id="where-does-all-that-energy-go">Where does all that energy go?</h1>

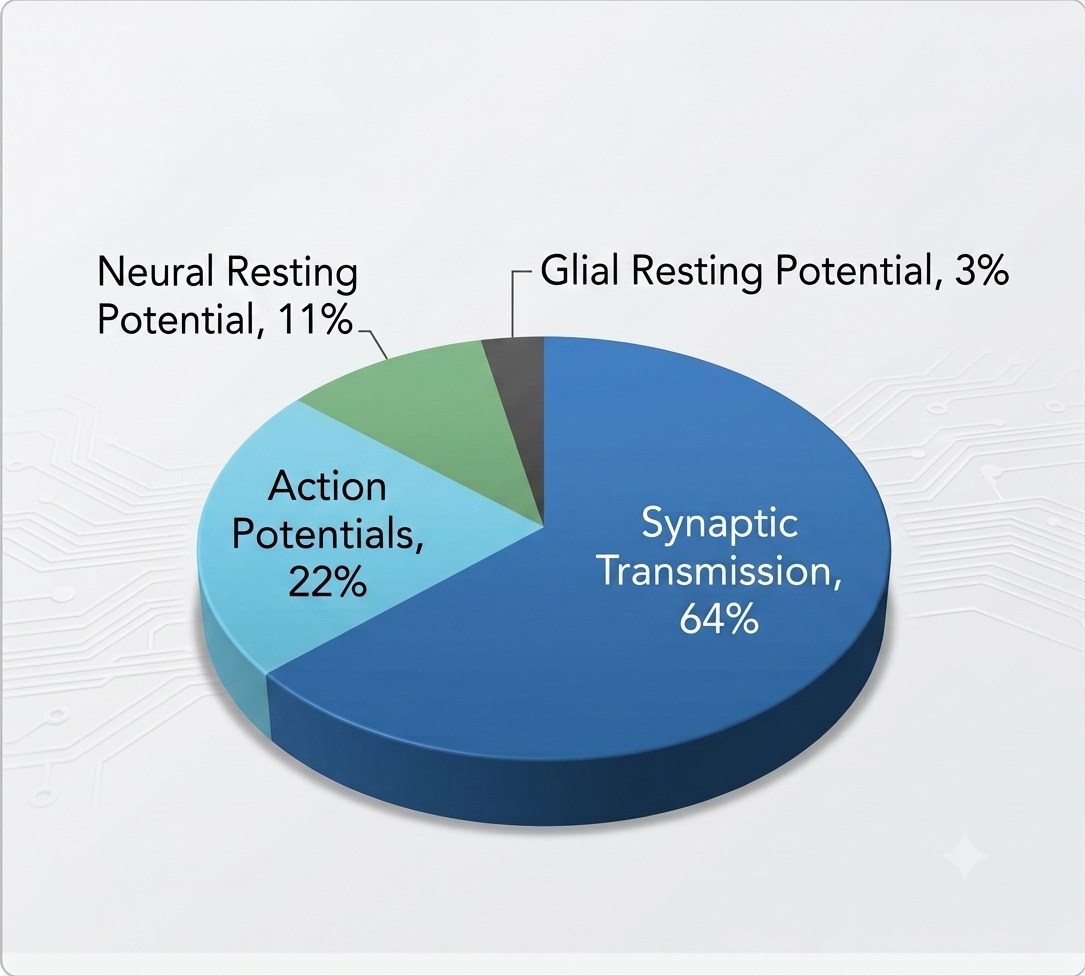
<p>If the brain is spending a fifth of your calories, it is fair to ask what it is buying. Researchers have built detailed energy budgets that break down the cost of electrical signaling in the grey matter of the cortex, and the results are illuminating (Harris, Jolivet, and Attwell, 2012; Sengupta et al., 2010).</p>

<p>The single largest expense is synaptic transmission, the work of passing messages from one neuron to the next across the tiny gaps called synapses. This includes packaging the neurotransmitter, releasing it, and, on the receiving side, letting ions flow through receptors and then pumping them back out. By these estimates, synaptic transmission alone can account for well over half of the brain’s signaling energy budget (Harris, Jolivet, and Attwell, 2012). The next biggest cost is firing the action potentials themselves, the brief electrical spikes neurons use to communicate. After that comes the comparatively modest cost of simply keeping neurons and their supporting glial cells at their resting voltage, ready to act.</p>

<p>The lesson here is subtle but important. Most of the brain’s energy is not spent thinking a thought in some abstract sense. It is spent on the physical machinery of communication, the synapses. And because synapses are where learning happens, this fact connects directly to the cost of learning itself.</p>

<p><img src="/images/hungry_brain_2.png" alt="Pie chart breaking down the brain's signaling energy budget: synaptic transmission 64 percent, action potentials 22 percent, neural resting potential 11 percent, glial resting potential 3 percent" width="450" /></p>

<p><em><strong>Fig. 2.</strong> Where the brain’s signaling energy goes. Adapted from Harris, Jolivet, &amp; Attwell (2012).</em></p>

<h1 id="the-cost-of-learning">The cost of learning</h1>

<p>We tend to think of learning as effortless, or at least free. Biologically, it is anything but. Learning means changing synapses, strengthening some connections, weakening others, and sometimes building entirely new ones. Since synaptic transmission is already the brain’s biggest energy expense, anything that adds to the number or strength of synapses also adds to the running cost of the brain for as long as those memories are maintained.</p>

<p>The clearest evidence that memory carries a real metabolic price tag comes, perhaps surprisingly, from fruit flies. In an elegant experiment, Plaçais and Preat (2013) showed that forming durable, long term memories is so energetically costly that starving flies actively switch the process off. When the researchers forced hungry flies to form long term memories anyway, the flies died sooner. Their title says it plainly. To favor survival under food shortage, the brain disables costly memory. Memory, in other words, is a luxury the body will sacrifice when energy is on the line.</p>

<p>In humans, the cost of building a brain in the first place is staggering. Kuzawa and colleagues (2014) combined brain imaging and metabolic data to track how much energy the developing human brain uses across childhood. They found that brain glucose consumption peaks in early to mid childhood, at which point the brain is using glucose at a rate equivalent to roughly two thirds of the body’s resting metabolism. Strikingly, this peak coincides with the slowest period of childhood body growth. The interpretation is that the metabolic demands of wiring up a young, learning brain are so high that the body literally slows its own physical growth to pay for them. Learning, development, and energy are bound together from our earliest years.</p>

<p>So when we talk about the cost of learning, we are not being metaphorical. Every lasting memory is a small, ongoing draw on a limited energy budget, and evolution has clearly treated that cost as something worth managing carefully.</p>

<h1 id="is-there-a-low-power-mode-of-the-neocortex-in-times-of-food-scarcity">Is there a low power mode of the neocortex in times of food scarcity?</h1>

<p>Here we arrive at the question at the heart of this post. We know the brain is expensive. We also know food is not always available. For most animals through most of history, calories have been volatile and unpredictable. So a natural question follows. When food runs low, can the cortex dial down its own energy use, the way a phone enters a battery saving mode? And if so, what does it cost in terms of performance?</p>

<p>For invertebrates, the answer was already suggestive (Plaçais and Preat, 2013). But the mammalian neocortex, the seat of perception and higher cognition, was a harder case to crack. That changed with a study by Padamsey and colleagues (2022), working in the visual cortex of mice.</p>

<p>Using detailed recordings from individual neurons and two photon imaging of cortical activity, they followed what happened when mice were food restricted until they lost about 15 percent of their body weight. The cortex did indeed shift into something very much like a low power mode. Neurons reduced the conductance of their excitatory AMPA receptors, which cut the ATP spent on synaptic currents by around 29 percent. Cleverly, the neurons kept firing at roughly normal rates by compensating in other ways, raising their input resistance and slightly depolarizing their resting voltage. From the outside, then, the cortex looked like it was working normally.</p>

<p>But the savings were not free. Running the synapses on a budget made the neurons’ responses noisier and less precise. The tuning of visual neurons, meaning how sharply they distinguish one line orientation from another, broadened by about 32 percent, and the animals became measurably worse at fine visual discrimination (Padamsey et al., 2022). In plain terms, the hungry cortex traded acuity for economy. It kept the lights on but turned down the resolution.</p>

<p>What links body fat to brain performance here is a hormone called leptin. Leptin is released by fat tissue and signals how much energy the body has in reserve, so when fat stores fall, leptin falls too. Padamsey and colleagues found that this drop in leptin was the trigger for the cortex’s energy saving changes. Remarkably, giving the food restricted mice supplemental leptin restored their coding precision (Padamsey et al., 2022). The brain, it seems, is listening to the body’s fuel gauge and adjusting its own performance accordingly. This is the work that earned the evocative description, in Quanta Magazine, of a brain low power mode that blunts the senses.</p>

<p>So the answer to the question is yes. The neocortex does appear to have a low power mode, and it is governed by the body’s energy signals. It is not a malfunction but an adaptation, a sensible way to keep an expensive organ running when the calories that power it are uncertain.</p>

<h1 id="what-it-all-means">What it all means</h1>

<p>Step back, and a coherent picture emerges. The brain is one of the most energy expensive tissues the body maintains, and most of that cost is paid at the synapse, the very place where learning lives. Because energy has always been uncertain in the natural world, evolution has equipped the brain with ways to manage the bill. It reallocates energy from the rest of the body, it signals efficiently, and, when necessary, it throttles its own performance to match the available fuel (Padamsey and Rochefort, 2023). The cortical low power mode is one striking example, complete with a measurable cost in perceptual precision and a hormonal trigger in leptin.</p>

<p>For anyone interested in the brain, the take home is that cognition cannot be separated from energy. How sharply you see, how well you remember, perhaps even how clearly you think, may depend in part on how recently, and how well, you have eaten. The brain is not a tireless computer running at a fixed clock speed. It is a living, expensive organ, constantly negotiating between the information it would like to process and the energy it can actually afford.</p>

<p><em><strong>Note on the science:</strong> figures such as 20 percent of resting energy and the synaptic share of the signaling budget are well established estimates that vary somewhat across studies and methods, so they are best read as robust approximations rather than exact constants. The food restriction findings described here come primarily from the mouse visual cortex. While they fit a broader pattern seen across species, caution is warranted before assuming the numbers transfer directly to humans.</em></p>

<h2 id="references">References</h2>

<div style="font-size: 0.8em; line-height: 1.4;">

  <p>Harris, J. J., Jolivet, R., &amp; Attwell, D. (2012). Synaptic energy use and supply. <em>Neuron, 75</em>(5), 762–777. <a href="https://doi.org/10.1016/j.neuron.2012.08.019">https://doi.org/10.1016/j.neuron.2012.08.019</a></p>

  <p>Herculano-Houzel, S. (2011). Scaling of brain metabolism with a fixed energy budget per neuron: Implications for neuronal activity, plasticity and evolution. <em>PLoS ONE, 6</em>(3), e17514. <a href="https://doi.org/10.1371/journal.pone.0017514">https://doi.org/10.1371/journal.pone.0017514</a></p>

  <p>Kuzawa, C. W., Chugani, H. T., Grossman, L. I., Lipovich, L., Muzik, O., Hof, P. R., Wildman, D. E., Sherwood, C. C., Leonard, W. R., &amp; Lange, N. (2014). Metabolic costs and evolutionary implications of human brain development. <em>Proceedings of the National Academy of Sciences, 111</em>(36), 13010–13015. <a href="https://doi.org/10.1073/pnas.1323099111">https://doi.org/10.1073/pnas.1323099111</a></p>

  <p>Padamsey, Z., Katsanevaki, D., Dupuy, N., &amp; Rochefort, N. L. (2022). Neocortex saves energy by reducing coding precision during food scarcity. <em>Neuron, 110</em>(2), 280–296. <a href="https://doi.org/10.1016/j.neuron.2021.10.024">https://doi.org/10.1016/j.neuron.2021.10.024</a></p>

  <p>Padamsey, Z., Katsanevaki, D., Maeso, P., Rizzi, M., Osterweil, E. K., &amp; Rochefort, N. L. (2024). Sex specific resilience of neocortex to food restriction. <em>eLife, 12</em>, RP93052. <a href="https://doi.org/10.7554/eLife.93052">https://doi.org/10.7554/eLife.93052</a></p>

  <p>Padamsey, Z., &amp; Rochefort, N. L. (2023). Paying the brain’s energy bill. <em>Current Opinion in Neurobiology, 78</em>, 102668. <a href="https://doi.org/10.1016/j.conb.2022.102668">https://doi.org/10.1016/j.conb.2022.102668</a></p>

  <p>Plaçais, P.-Y., &amp; Preat, T. (2013). To favor survival under food shortage, the brain disables costly memory. <em>Science, 339</em>(6118), 440–442. <a href="https://doi.org/10.1126/science.1226018">https://doi.org/10.1126/science.1226018</a></p>

  <p>Sengupta, B., Stemmler, M., Laughlin, S. B., &amp; Niven, J. E. (2010). Action potential energy efficiency varies among neuron types in vertebrates and invertebrates. <em>PLoS Computational Biology, 6</em>(7), e1000840. <a href="https://doi.org/10.1371/journal.pcbi.1000840">https://doi.org/10.1371/journal.pcbi.1000840</a></p>

</div>]]></content><author><name>Adem Gashi</name><email>adem.gashi@unige.ch</email></author><category term="brain energy metabolism" /><category term="leptin" /><category term="cognitive neuroscience" /><summary type="html"><![CDATA[Your brain weighs about as much as a small melon, yet it eats like a teenager. Even when you are sitting still and thinking about nothing in particular, it burns through energy at a rate that no other organ of its size comes close to. This single fact, that the brain is metabolically expensive, turns out to be one of the most important constraints in all of neuroscience. It shapes how neurons are built, how they signal, how we learn, and, as recent work suggests, how the brain rations its own performance when food becomes scarce.]]></summary></entry><entry><title type="html">Why do two people of the same age have such different brains?</title><link href="https://ademgashi.com/posts/2026/06/same-age-different-brains/" rel="alternate" type="text/html" title="Why do two people of the same age have such different brains?" /><published>2026-06-16T00:00:00+00:00</published><updated>2026-06-16T00:00:00+00:00</updated><id>https://ademgashi.com/posts/2026/06/blog-post-1</id><content type="html" xml:base="https://ademgashi.com/posts/2026/06/same-age-different-brains/"><![CDATA[<p>As people live longer, more and more individuals reach old age without ever developing dementia. That is good news. But it has opened a quieter, more interesting puzzle: even among adults who never cross the threshold into disease, aging does not look the same for everyone. Two people who share a birth year can have brains and cognitive profiles that look strikingly different, and those differences tend to widen as we follow people over time rather than narrow.</p>

<p>A useful way to picture this is to imagine two seventy year olds. One stays physically active, remains socially engaged, and has well controlled blood pressure and blood sugar. The other lives with diabetes, hypertension, and chronic stress. They share the same chronological age, yet their brains may be aging at very different rates. That gap, between two people the calendar treats as identical, is what this post is about.</p>

<p>This variability is not noise to be averaged away. It is, I will argue, the actual phenomenon worth studying. My thesis starts from the premise that the most informative question in cognitive aging is not <em>how much does the average brain decline</em>, but <em>why do individuals decline so differently from one another</em>, and whether those changes become coordinated across brain and cognitive systems.</p>

<p>It also helps to be precise about one word. Throughout this post I use <strong>normative aging</strong> to mean the statistically typical pattern of change in people who are aging without diagnosed disease. That is different from <strong>successful aging</strong>, which is a value laden ideal of aging well. My interest is in the normative case, and specifically in the spread around the average, not in the average alone.</p>

<h1 id="chronological-age-versus-biological-brain-aging">Chronological age versus biological brain aging</h1>

<p>Before going further, one distinction does a lot of work in this field. Chronological age is simply how many years have passed since birth. Biological brain aging is how much a given brain has actually changed, structurally and functionally, regardless of the calendar. These two can come apart substantially, which is exactly why two people of the same chronological age can have very different brains.</p>

<p>This is also where one of the field’s central ideas enters early, because it will matter for everything that follows. Researchers increasingly emphasize <strong>brain maintenance</strong>, the relative preservation of brain structure and function over time (Nyberg et al., 2012). The core claim is that the people who stay cognitively sharp are often those whose brains accumulate less change across the lifespan, not necessarily those who started with the most. Hold on to that idea. It is fundamentally a claim about <em>change over time</em>, and that property will become important when we get to methods.</p>

<h1 id="the-figure-same-age-different-brains">The figure: same age, different brains</h1>

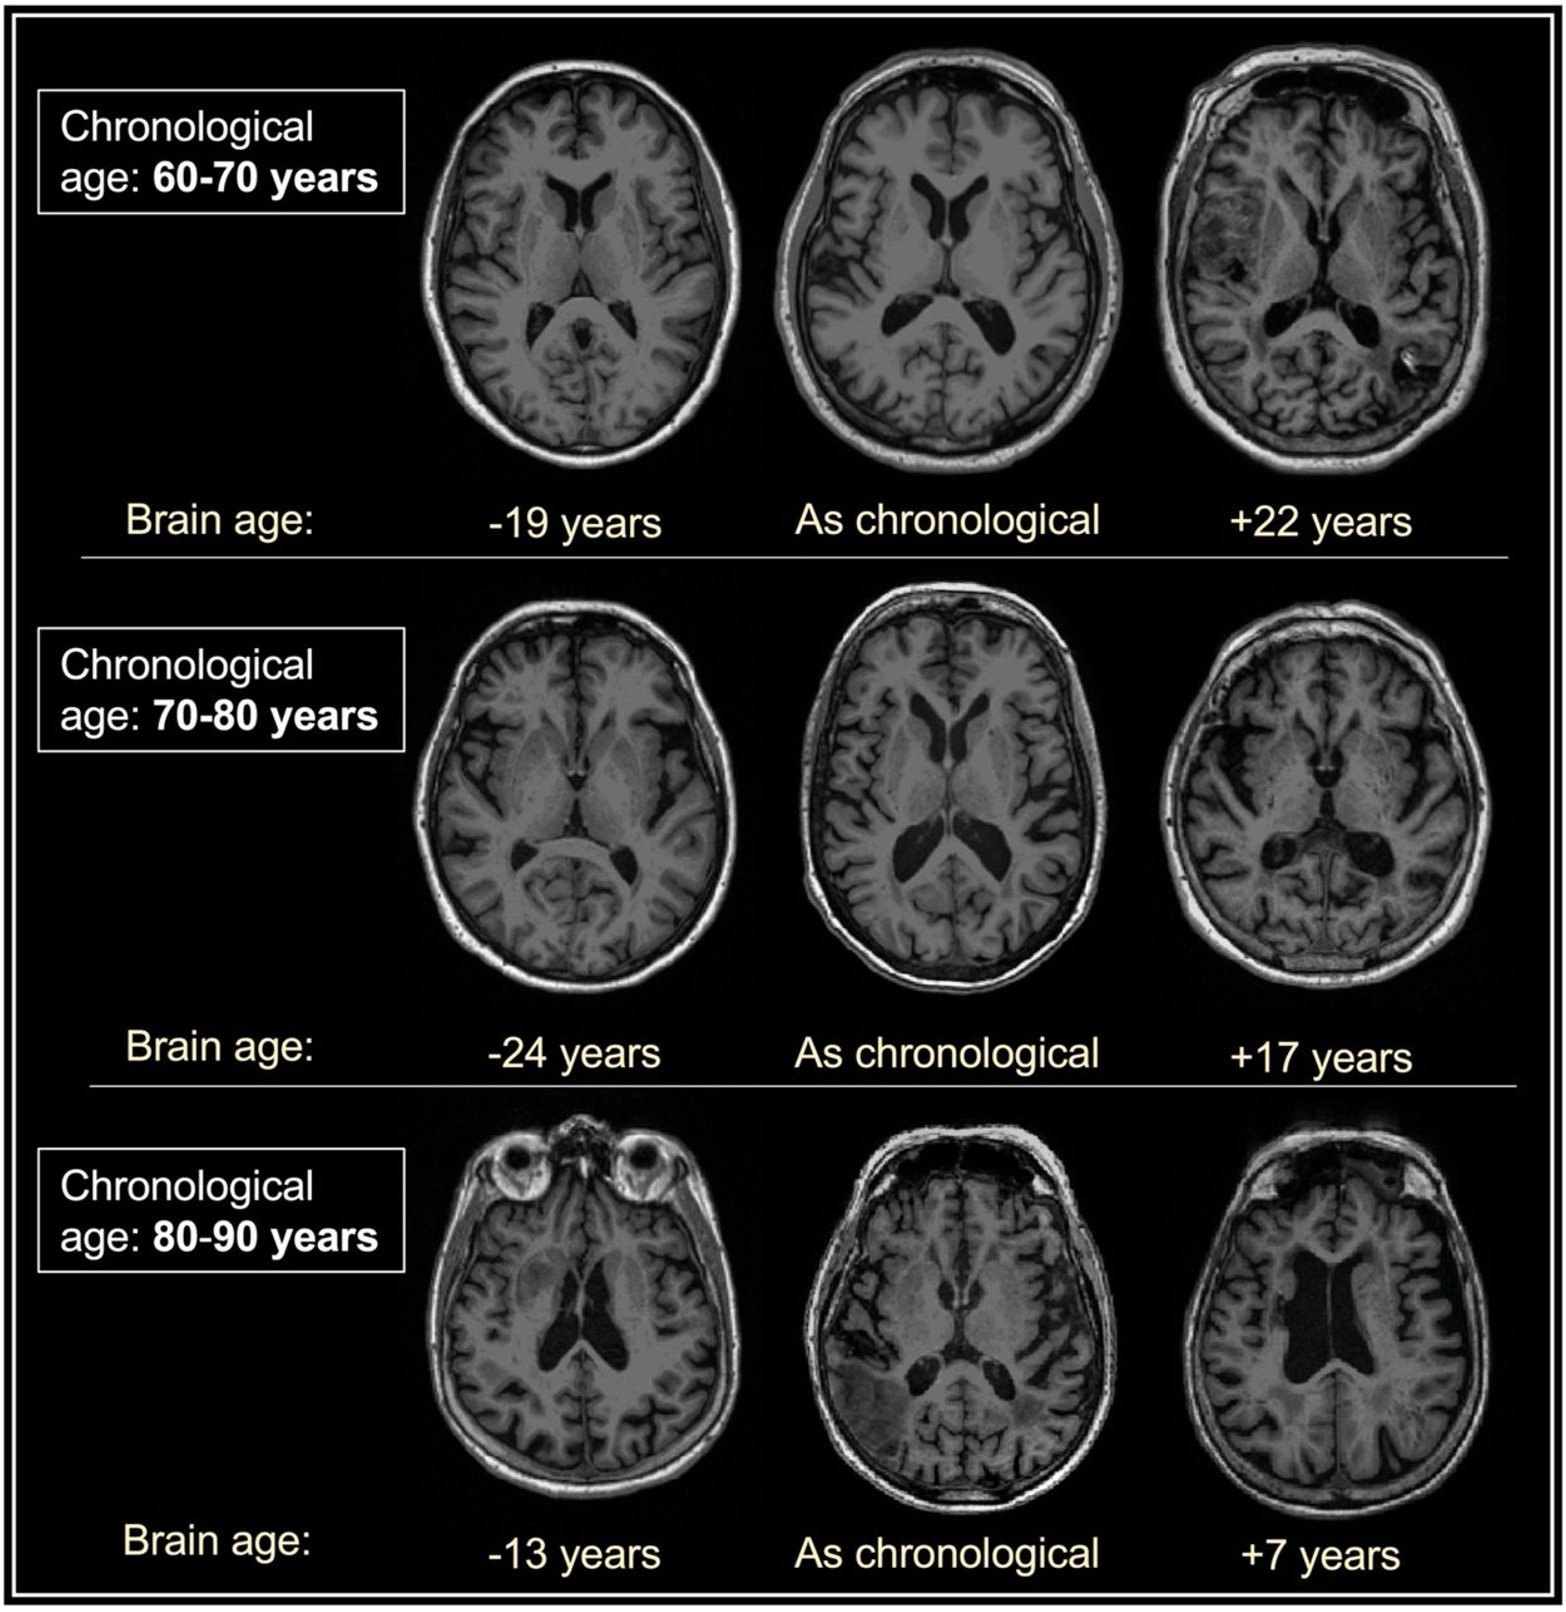
<p><img src="/images/heterogenity.jpg" alt="Axial MRI slices from individuals in three chronological age bands, showing markedly different brain structure within each band" /></p>

<p><em><strong>Fig. 1.</strong> Interindividual heterogeneity in brain structural aging among individuals of similar chronological age. The estimates shown are illustrative and schematic, included only to convey dispersion, not as outputs of a validated model fit. Adapted from Cole &amp; Franke (2017).</em></p>

<p>The image above is meant purely as an illustration of heterogeneity. Each row shows people within the same chronological age range. What you should take from it is simple: their brain structure looks quite different. Some brains appear relatively preserved. Others look close to what we would expect for that age. Others show more pronounced structural aging.</p>

<p>The point here is not the brain-age estimates themselves, and I want to be careful about that, because brain-age models carry their own assumptions and error (Cole &amp; Franke, 2017). The point is the dispersion. Chronological age alone does not capture how a given brain has aged. People of the same age differ substantially in brain structure, and this is exactly what the broader literature reports: normal aging is accompanied by decline in both brain structure and cognition that varies considerably between individuals, large enough that it poses a challenge for generalizing across studies (Oschwald et al., 2020). Some individuals show accelerated deterioration while others maintain function well into old age, and even within one person some cognitive domains stay intact while others become vulnerable.</p>

<h1 id="why-averages-mislead-and-why-we-need-within-person-data">Why averages mislead, and why we need within-person data</h1>

<p>Here is the methodological heart of the matter. A cross-sectional snapshot, comparing different people of different ages at one moment, cannot separate two things that look identical in a static picture but are fundamentally different: how high someone started (their intercept) and how fast they are changing (their slope). Two people can sit at the same point today because one began higher and is declining quickly, while the other began lower and is barely changing at all. Only repeated measurement of the <em>same</em> individuals can tell these apart.</p>

<p>This is not a small statistical nicety, and the problem cuts in both directions. Cross-sectional age gradients can <em>overstate</em> decline, because they confound true within-person change with differences between birth cohorts; people born decades apart differ for reasons that have nothing to do with aging. Longitudinal designs solve that confound, but they introduce their own challenges, such as practice effects and selective dropout, where healthier participants are more likely to return. The way to read these designs is therefore as complementary, with longitudinal data being indispensable for the specific question of <em>change</em>.</p>

<p>This is not just a theoretical concern, and the evidence is unusually clean. When the same healthy adults were followed over five years with repeated MRI, longitudinal measures of brain shrinkage exceeded the estimates implied by cross-sectional age differences, and nearly every region studied showed reliable individual differences in the <em>rate</em> of change (Raz et al., 2005). The relationship between the two kinds of estimate also turned out to be region specific and unpredictable. For the prefrontal cortex, the cross-sectional trend happened to approximate the true rate of change well. For the caudate and the cerebellum, it grossly underestimated how fast those regions were shrinking. And for the inferior parietal lobule, the cross-sectional comparison missed reliable change entirely, change that only the longitudinal analysis could detect (Raz &amp; Lindenberger, 2011). In other words, a snapshot does not just blur the picture by a fixed amount you could correct for. It distorts different regions in different directions, so you cannot know in advance whether it is overstating, understating, or completely missing what is happening inside a given person.</p>

<p>There is a second reason within-person data matter. When researchers measure change directly, the factor structure underlying <em>baseline</em> brain differences need not match the structure underlying <em>change</em>, and correlations between regional brain changes can be stronger than the correlations seen at baseline (Raz et al., 2005; Oschwald et al., 2020). In plain terms: the way brains <em>change together</em> over time is a different, and arguably more meaningful, pattern than the way they happen to <em>differ</em> at one snapshot. This has a sharp methodological consequence. Even a statistical model that perfectly explains who differs from whom today cannot tell you how those people are changing, in what order, or why, because estimates derived from differences are systematically biased as descriptions of change (Raz &amp; Lindenberger, 2011). Knowing that one brain region statistically accounts for variation in another at a single timepoint does not establish that the two change together, that one change precedes the other, or that one drives the other. If we want to understand coordinated aging across systems, we therefore have to measure change directly. This is why my work focuses on longitudinal, within-person trajectories rather than cross-sectional contrasts.</p>

<p>And this is where brain maintenance returns. Maintenance, and the related idea of brain reserve, are fundamentally claims about <em>change over time</em> (Nyberg et al., 2012). Maintenance proposes that the people who stay cognitively sharp are those whose brains accumulate less pathology and structural change across the lifespan, not necessarily those who started with more. You cannot test a theory about maintenance with a single snapshot. You need to watch the maintaining happen, or fail to happen.</p>

<h1 id="why-longitudinal-studies-change-the-picture">Why longitudinal studies change the picture</h1>

<p>It is worth pausing on this point on its own, because it is easy to underestimate. Most of what we know about brain aging comes from comparing different people at one point in time. Those cross-sectional studies are valuable and far cheaper to run, but they can only ever describe age <em>differences</em> between people. Longitudinal studies, which follow the same individuals over years, describe age <em>changes</em> within people. Only the second design can show how and why people diverge, because only it lets us separate where someone began from how they are aging. The Raz et al. (2005) study is a concrete example of the payoff: following the same adults revealed both that decline was steeper than the cross-sectional picture suggested and that individuals differed reliably in their rates of change, with hypertension already visible as a modifier (Raz et al., 2005). That combination, real average change plus reliable individual differences in that change, is exactly what a thesis about heterogeneity needs, and it is exactly what a snapshot cannot deliver.</p>

<p>There is one subtlety worth flagging, because it cuts against a tempting conclusion. Sometimes studies fail to find that individual differences grow with age and take that as evidence the differences are not there. But detecting individual differences in <em>change</em>, rather than in <em>level</em>, is statistically demanding, and the power to do so in typical longitudinal designs is often low, especially when measurements are not highly reliable (Raz &amp; Lindenberger, 2011). When researchers use adequately powered designs and tools built for the purpose, the heterogeneity does tend to appear (Raz &amp; Lindenberger, 2011). The lesson for a thesis like mine is to treat a null result as a possible failure of measurement, not as proof that everyone ages alike.</p>

<h1 id="beyond-age-metabolic-and-vascular-health-as-modifiers">Beyond age: metabolic and vascular health as modifiers</h1>

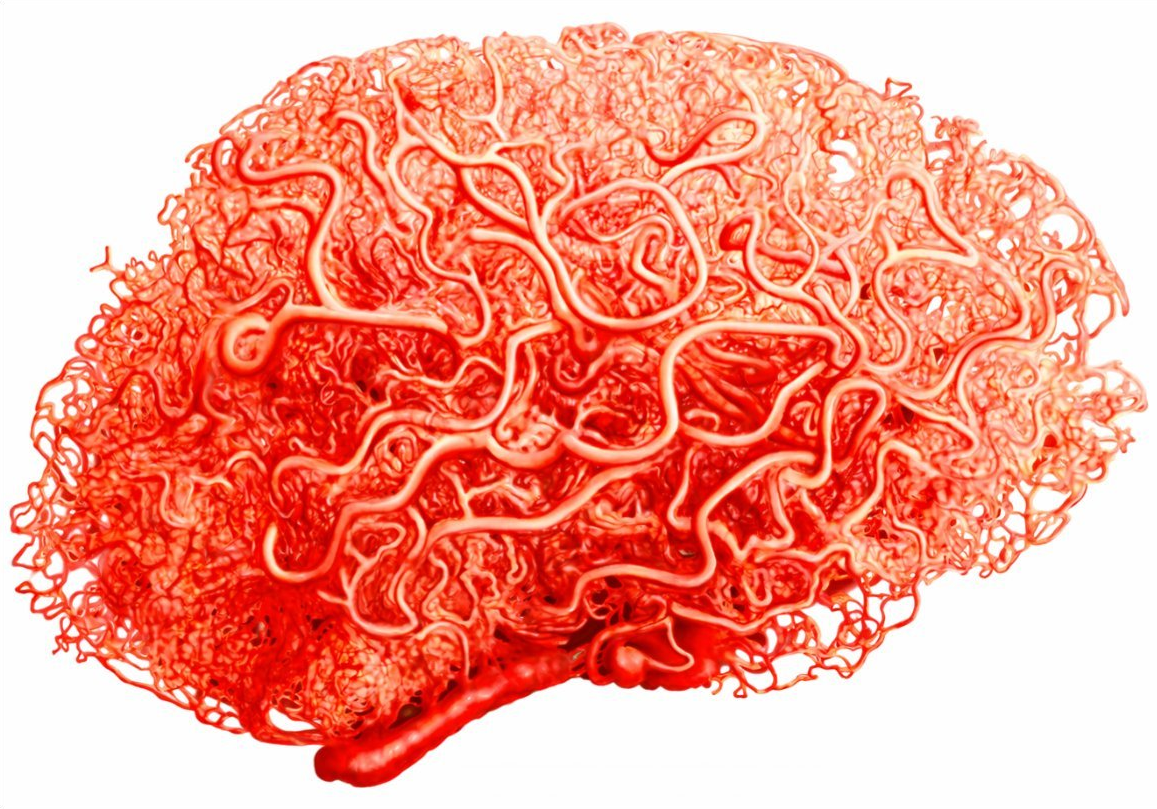
<p><img src="/images/vascular_brain.png" alt="Resin cast of the dense, intricate network of cerebral blood vessels shaped like a brain" /></p>

<p><em><strong>Fig. 2.</strong> The highly complex cerebral vascular network, highlighting the intricacy of brain blood supply. (ETH Zurich, 2023.)</em></p>

<p>If chronological age does not explain why trajectories diverge, what does? One of the most robust answers from the last two decades is that metabolic and vascular health acts as a <em>modifier</em> of how the brain and cognition change, shaping the slope rather than simply marking the presence of disease. The dense vascular network in Fig. 2 is a useful reminder of why: every neuron depends on this delicate supply, so changes in cerebrovascular function are one plausible route by which subclinical vascular burden could leave a structural trace, alongside others such as blood brain barrier integrity and small vessel disease.</p>

<p>The evidence is consistent across several layers.</p>

<p><strong>Vascular risk rises with age</strong>, so the aging brain is increasingly exposed to it, but exposure varies enormously between individuals, which is precisely what generates divergent trajectories (Raz, 2020).</p>

<p><strong>Midlife hypertension predicts later dementia.</strong> In the Honolulu-Asia Aging Study, among men never treated with antihypertensive medication, diastolic blood pressure of 95 mmHg or higher in midlife carried roughly a fourfold increase in later dementia risk compared with the normal range, after adjusting for age, education, <em>APOE</em> genotype, smoking, and alcohol (Launer et al., 2000). This was a male only cohort, so the precise estimate should be read in that light, but the decades long gap between the exposure and the outcome is the key feature: midlife vascular health is shaping a trajectory that only becomes visible much later.</p>

<p><strong>Metabolic risk in midlife is linked to poorer later cognition.</strong> Work from our own group has shown that a latent metabolic risk factor, built from the blood and physiological markers that define the metabolic syndrome, relates to fluid intelligence changes in healthy adults followed longitudinally (Ghisletta et al., 2019). This matters because it treats metabolic risk as a coherent construct rather than a list of separate symptoms.</p>

<p><strong>Even high-normal glucose, in people without diabetes, is not benign.</strong> In cognitively healthy older adults free of type 2 diabetes, higher fasting plasma glucose <em>within the normal range</em> (below 6.1 mmol/L) was associated with greater atrophy of the hippocampus and amygdala over four years (Cherbuin et al., 2012). This came from a single cohort, so it should be read as one well controlled observation rather than a settled fact, but the authors explicitly suggested it should make us reconsider what we treat as a “normal” glucose level. The implication for my framing is important: these are subclinical, dose-graded effects, which is exactly what you would expect from a <em>modifier</em> of normative aging rather than a discrete pathological switch.</p>

<p>Taken together, these findings support a specific claim: metabolic and vascular health do not merely flag people who are already sick. They appear to bend the trajectory of brain structure and cognition across the whole range of variation, including in people who never become patients. That is what makes them so relevant to a thesis about heterogeneity. They are a plausible source of <em>why people diverge</em>. It is also worth returning to the two seventy year olds from the start. The active one and the one living with diabetes and hypertension are not a rhetorical device; they are, in effect, two ends of the exposure distribution these studies describe.</p>

<h1 id="where-this-leads">Where this leads</h1>

<p>So the through-line of my work is this. Heterogeneity in brain and cognitive aging is real, it grows over time, and chronological age is a weak explanation for it. To study it properly we have to move from cross-sectional comparison to within-person change, because only change can distinguish where someone started from how they are aging, and only change can test the maintenance and reserve frameworks that the field relies on. And among the candidate explanations for divergence, metabolic and vascular health stand out as modifiable factors that shape trajectories well before any clinical diagnosis appears.</p>

<p>The rest of my thesis asks the natural next question: when one system declines, do others follow? In other words, do these individual differences in change become <em>coordinated</em> across brain regions and cognitive domains over time? Answering that requires methods built specifically for within-person change, such as latent change score models and coupled growth models, which estimate not just how each system changes but whether their changes travel together. That is where the longitudinal modeling begins.</p>

<h2 id="references">References</h2>

<div style="font-size: 0.8em; line-height: 1.4;">

  <p>Cherbuin, N., Sachdev, P., &amp; Anstey, K. J. (2012). Higher normal fasting plasma glucose is associated with hippocampal atrophy: The PATH Study. <em>Neurology, 79</em>(10), 1019–1026. <a href="https://doi.org/10.1212/WNL.0b013e31826846de">https://doi.org/10.1212/WNL.0b013e31826846de</a></p>

  <p>Cole, J. H., &amp; Franke, K. (2017). Predicting age using neuroimaging: Innovative brain ageing biomarkers. <em>Trends in Neurosciences, 40</em>(12), 681–690. <a href="https://doi.org/10.1016/j.tins.2017.10.001">https://doi.org/10.1016/j.tins.2017.10.001</a></p>

  <p>Ghisletta, P., Mason, F., Dahle, C. L., &amp; Raz, N. (2019). Metabolic risk affects fluid intelligence changes in healthy adults. <em>Psychology and Aging, 34</em>(7), 912–920. <a href="https://doi.org/10.1037/pag0000402">https://doi.org/10.1037/pag0000402</a></p>

  <p>Launer, L. J., Ross, G. W., Petrovitch, H., Masaki, K., Foley, D., White, L. R., &amp; Havlik, R. J. (2000). Midlife blood pressure and dementia: The Honolulu-Asia Aging Study. <em>Neurobiology of Aging, 21</em>(1), 49–55. <a href="https://doi.org/10.1016/S0197-4580(00)00096-8">https://doi.org/10.1016/S0197-4580(00)00096-8</a></p>

  <p>Nyberg, L., Lövdén, M., Riklund, K., Lindenberger, U., &amp; Bäckman, L. (2012). Memory aging and brain maintenance. <em>Trends in Cognitive Sciences, 16</em>(5), 292–305. <a href="https://doi.org/10.1016/j.tics.2012.04.005">https://doi.org/10.1016/j.tics.2012.04.005</a></p>

  <p>Oschwald, J., Guye, S., Liem, F., Rast, P., Willis, S., Röcke, C., Jäncke, L., Martin, M., &amp; Mérillat, S. (2020). Brain structure and cognitive ability in healthy aging: A review on longitudinal correlated change. <em>Reviews in the Neurosciences, 31</em>(1), 1–57. <a href="https://doi.org/10.1515/revneuro-2018-0096">https://doi.org/10.1515/revneuro-2018-0096</a></p>

  <p>Raz, N. (2020). Brains, hearts, and minds: Trajectories of neuroanatomical and cognitive change and their modification by vascular and metabolic factors. In <em>The Cognitive Neurosciences</em> (6th ed.). The MIT Press. <a href="https://doi.org/10.7551/mitpress/11442.001.0001">https://doi.org/10.7551/mitpress/11442.001.0001</a></p>

  <p>Raz, N., &amp; Lindenberger, U. (2011). Only time will tell: Cross-sectional studies offer no solution to the age–brain–cognition triangle: Comment on Salthouse (2011). <em>Psychological Bulletin, 137</em>(5), 790–795. <a href="https://doi.org/10.1037/a0024503">https://doi.org/10.1037/a0024503</a></p>

  <p>Raz, N., Lindenberger, U., Rodrigue, K. M., Kennedy, K. M., Head, D., Williamson, A., Dahle, C., Gerstorf, D., &amp; Acker, J. D. (2005). Regional brain changes in aging healthy adults: General trends, individual differences and modifiers. <em>Cerebral Cortex, 15</em>(11), 1676–1689. <a href="https://doi.org/10.1093/cercor/bhi044">https://doi.org/10.1093/cercor/bhi044</a></p>

</div>]]></content><author><name>Adem Gashi</name><email>adem.gashi@unige.ch</email></author><category term="cognitive aging" /><category term="brain aging" /><category term="longitudinal methods" /><category term="vascular health" /><category term="brain maintenance" /><summary type="html"><![CDATA[As people live longer, more and more individuals reach old age without ever developing dementia. That is good news. But it has opened a quieter, more interesting puzzle: even among adults who never cross the threshold into disease, aging does not look the same for everyone. Two people who share a birth year can have brains and cognitive profiles that look strikingly different, and those differences tend to widen as we follow people over time rather than narrow.]]></summary></entry></feed>